In May, homes sold faster than at virtually any other time in the past decade, according to the June RE/MAX National Housing Report.
“Even with low inventory and the Federal Reserve raising interest rates, homes are going from ‘for sale’ to sold 28 percent faster than three years ago,” says Adam Contos, CEO of RE/MAX. “Be prepared—that’s my message to potential homebuyers in this summer selling season. Make sure you are preapproved with a lender, try to make a clean offer with no contingencies and, if possible, consider offering favorable concessions to the seller such as a flexible closing date. Pairing today’s real estate technology with the guidance of a professional RE/MAX agent can help you find the right home.”
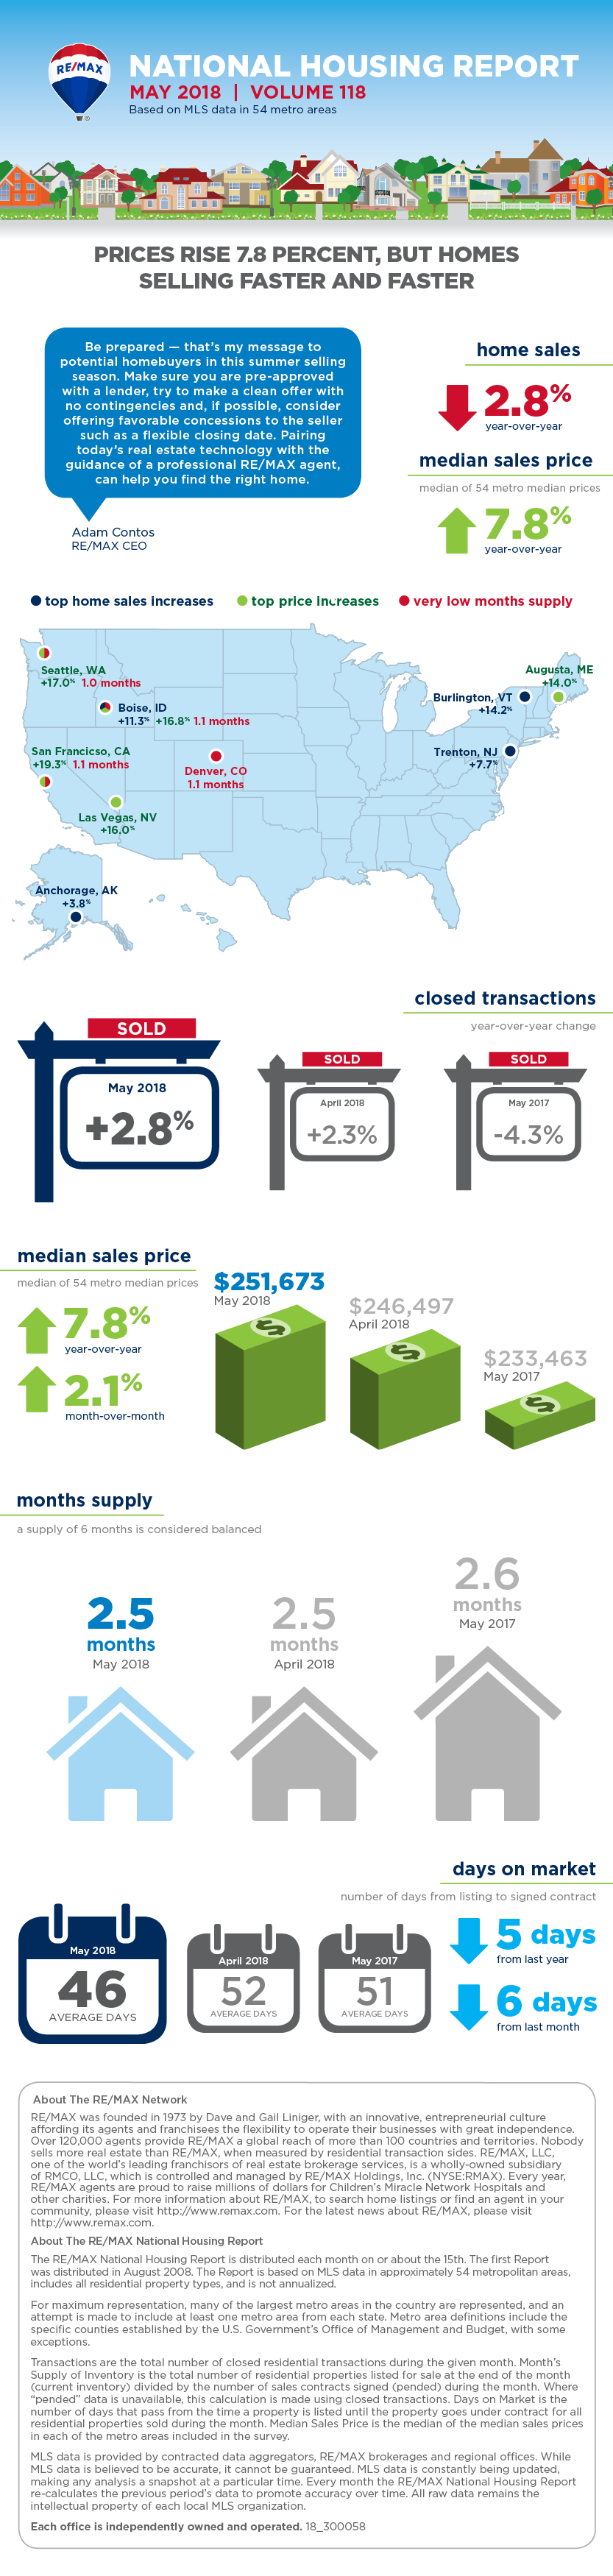
Closed Transactions
Of the 54 metro areas surveyed in May 2018, the overall average number of home sales increased 14.5 percent compared to April 2018 and decreased 2.8 percent compared to May 2017. Sixteen of the 54 metro areas experienced an increase in sales year-over-year, including, Burlington, Vt., +14.2 percent, Boise, Idaho, +11.3 percent, Trenton, N.J., +7.7 percent, and Anchorage, Alaska, +3.8 percent.
Median Sales Price
In May 2018, the median of all 54 metro median sales prices was $251,673, up 2.1 percent from April 2018 and up 7.8 percent from May 2017. Three metro areas saw a year-over-year decrease in median sales price: Trenton, N.J., -2.4 percent, Anchorage, Alaska, -1.2 percent, and Hartford, Conn., -0.7 percent. Eleven metro areas increased year-over-year by double-digit percentages, with the largest increases seen in San Francisco, Calif., +19.3 percent, Boise, Idaho, +16.8 percent, Las Vegas, Nev., +16 percent, and Augusta, Maine, +14 percent.
Days on Market
The average days on market for homes sold in May 2018 was 46, down six days from the average in April 2018, and down five days from the May 2017 average. The metro areas with the lowest days on market were San Francisco, Calif., and Seattle, Wash., at 19, Denver, Colo., at 21, and Salt Lake City, Utah, at 25. The highest days on market averages were in Augusta, Maine, at 115, Hartford, Conn., at 83, and New York, N.Y., and Miami, Fla., at 82. Days on market is the number of days between when a home is first listed in an MLS and a sales contract is signed.
Months Supply of Inventory
The number of homes for sale in May 2018 was up 4 percent from April 2018, and down 9.5 percent from May 2017. Based on the rate of home sales in May, the months supply of inventory was unchanged from April 2018 at 2.5, and slightly decreased compared to 2.6 in May 2017. A 6.0-months supply indicates a market balanced equally between buyers and sellers. In May 2018, all 54 metro areas surveyed reported a months supply at or less than 6.0, which is typically considered a seller’s market. The markets with the lowest months supply of inventory are in the West, with San Francisco, Calif., at 1.0 and Boise, Idaho, Denver, Colo., and Seattle, Wash., tied at 1.1.
For more information, please visit www.remax.com.
For the latest real estate news and trends, bookmark RISMedia.com.